Google Cloud
Overview
This tutorial covers how to configure certain Google Cloud Platform (GCP) components so that you can analyze your Cloudflare Logs data.
Before proceeding, you need to enable Cloudflare Logpush in Google Cloud Storage to ensure your log data is available for analyzing.
The components we’ll use in this tutorial include:
- Google Cloud Function to import logs from Google Cloud Storage to Google BigQuery
- Google BigQuery to make log data available to the reporting engine, and
- Google Data Studio to run interactive reports
The following diagram depicts how data flows from Cloudflare Logs through the different components of the Google Cloud Platform discussed in this tutorial.

Task 1 - Use Google Cloud Function to import log data into Google BigQuery
After you configured Cloudflare Logpush to send your logs to a Google Cloud Storage bucket, your log data updates every five minutes by default.
Google BigQuery makes data available for both querying using Structured Query Language (SQL) and for configuring as a data source for the Google Data Studio reporting engine. BigQuery is a highly scalable cloud database where SQL queries run quite fast.
Importing data from Google Cloud Storage into Google BigQuery requires creating a function using Google Cloud Function and running it in the Google Cloud Shell. This function triggers every time new Cloudflare log data is uploaded to your Google Cloud Storage bucket.
Clone and deploy a Google Cloud Function
To a create a cloud function to import data from Google Cloud Storage into Google BigQuery, you will need the following GitHub repository from Cloudflare: https://github.com/cloudflare/GCS-To-Big-Query.
To clone and deploy the cloud function:
Run the Google Cloud Platform shell by opening the Google Cloud Platform console and clicking the Google Shell icon (Activate Cloud Shell).
Run the following command to download the master zipped archive, uncompress the files to new a directory, and change the command line prompt to the new directory:
curl -LO "https://github.com/cloudflare/cloudflare-gcp/archive/master.zip" && unzip master.zip && cd cloudflare-gcp-master/logpush-to-bigqueryNext, edit the
deploy.shfile and make sure that:
BUCKET_NAME is set to the bucket you created when you configured Cloudflare Logpush with Google Cloud Platform.
DATASET and TABLE are unique names.
The contents of
deploy.shshould look similar to this:...BUCKET_NAME="my_cloudflarelogs_gcp_storage_bucket"DATASET="my_cloudflare_logs"TABLE="cloudflare_logs"...
- Then in the Google Shell, run the following command to deploy your instance of the cloud function:sh ./deploy.sh
Once you’ve deployed your new cloud function, verify that it appears in the Cloud Functions interface by navigating to Google Cloud Platform > Compute > Cloud Functions.
Also, verify that the data now appears in your table in BigQuery by navigating to the appropriate project in Google Cloud Platform > Big Data > BigQuery.
If everything is configured correctly, you can now query any request or visualize data with Google Data Studio or any other analytics tool that supports BigQuery as an input source.
Add fields in Google Cloud Function
To add fields in Cloud Function, edit the schema.json file.
Open Google Cloud Function.
Select the function you want to update.
Click EDIT on the Function details page.
Select
schema.jsonfrom the list of files.In the file editor, enter the
name,type, andmodeof any fields you would like to add. Follow the format shown in the file.Click Deploy.
To debug in Cloud Function, click VIEW LOGS on the Function details page. This will take you to the Logs Viewer, where any errors will appear.
Add fields in BigQuery
To add fields in BigQuery, edit the schema.
Open BigQuery.
In the menu, expand your-project-name.
Expand cloudflare_data and click cf_analytics_logs.
Select the Schema tab.
Scroll to the bottom of the page, and click Edit schema.
On the pop-up page, click Add field. Enter the field Name and select the field Type and Mode from the dropdowns.
Click Save.
Task 2 - Analyze log data with Google Data Studio
To analyze and visualize logs, you can use Google Data Studio or any other 3rd party services that supports Google BigQuery as an input source.
With Google Data Studio, you can generate graphs and charts from a Google BigQuery table. You can also refresh the data in your reports and get real-time analytics.
About the Cloudflare Logs Insights Template
Cloudflare has published a Logs Insights Template in the Google Data Studio Report Gallery.

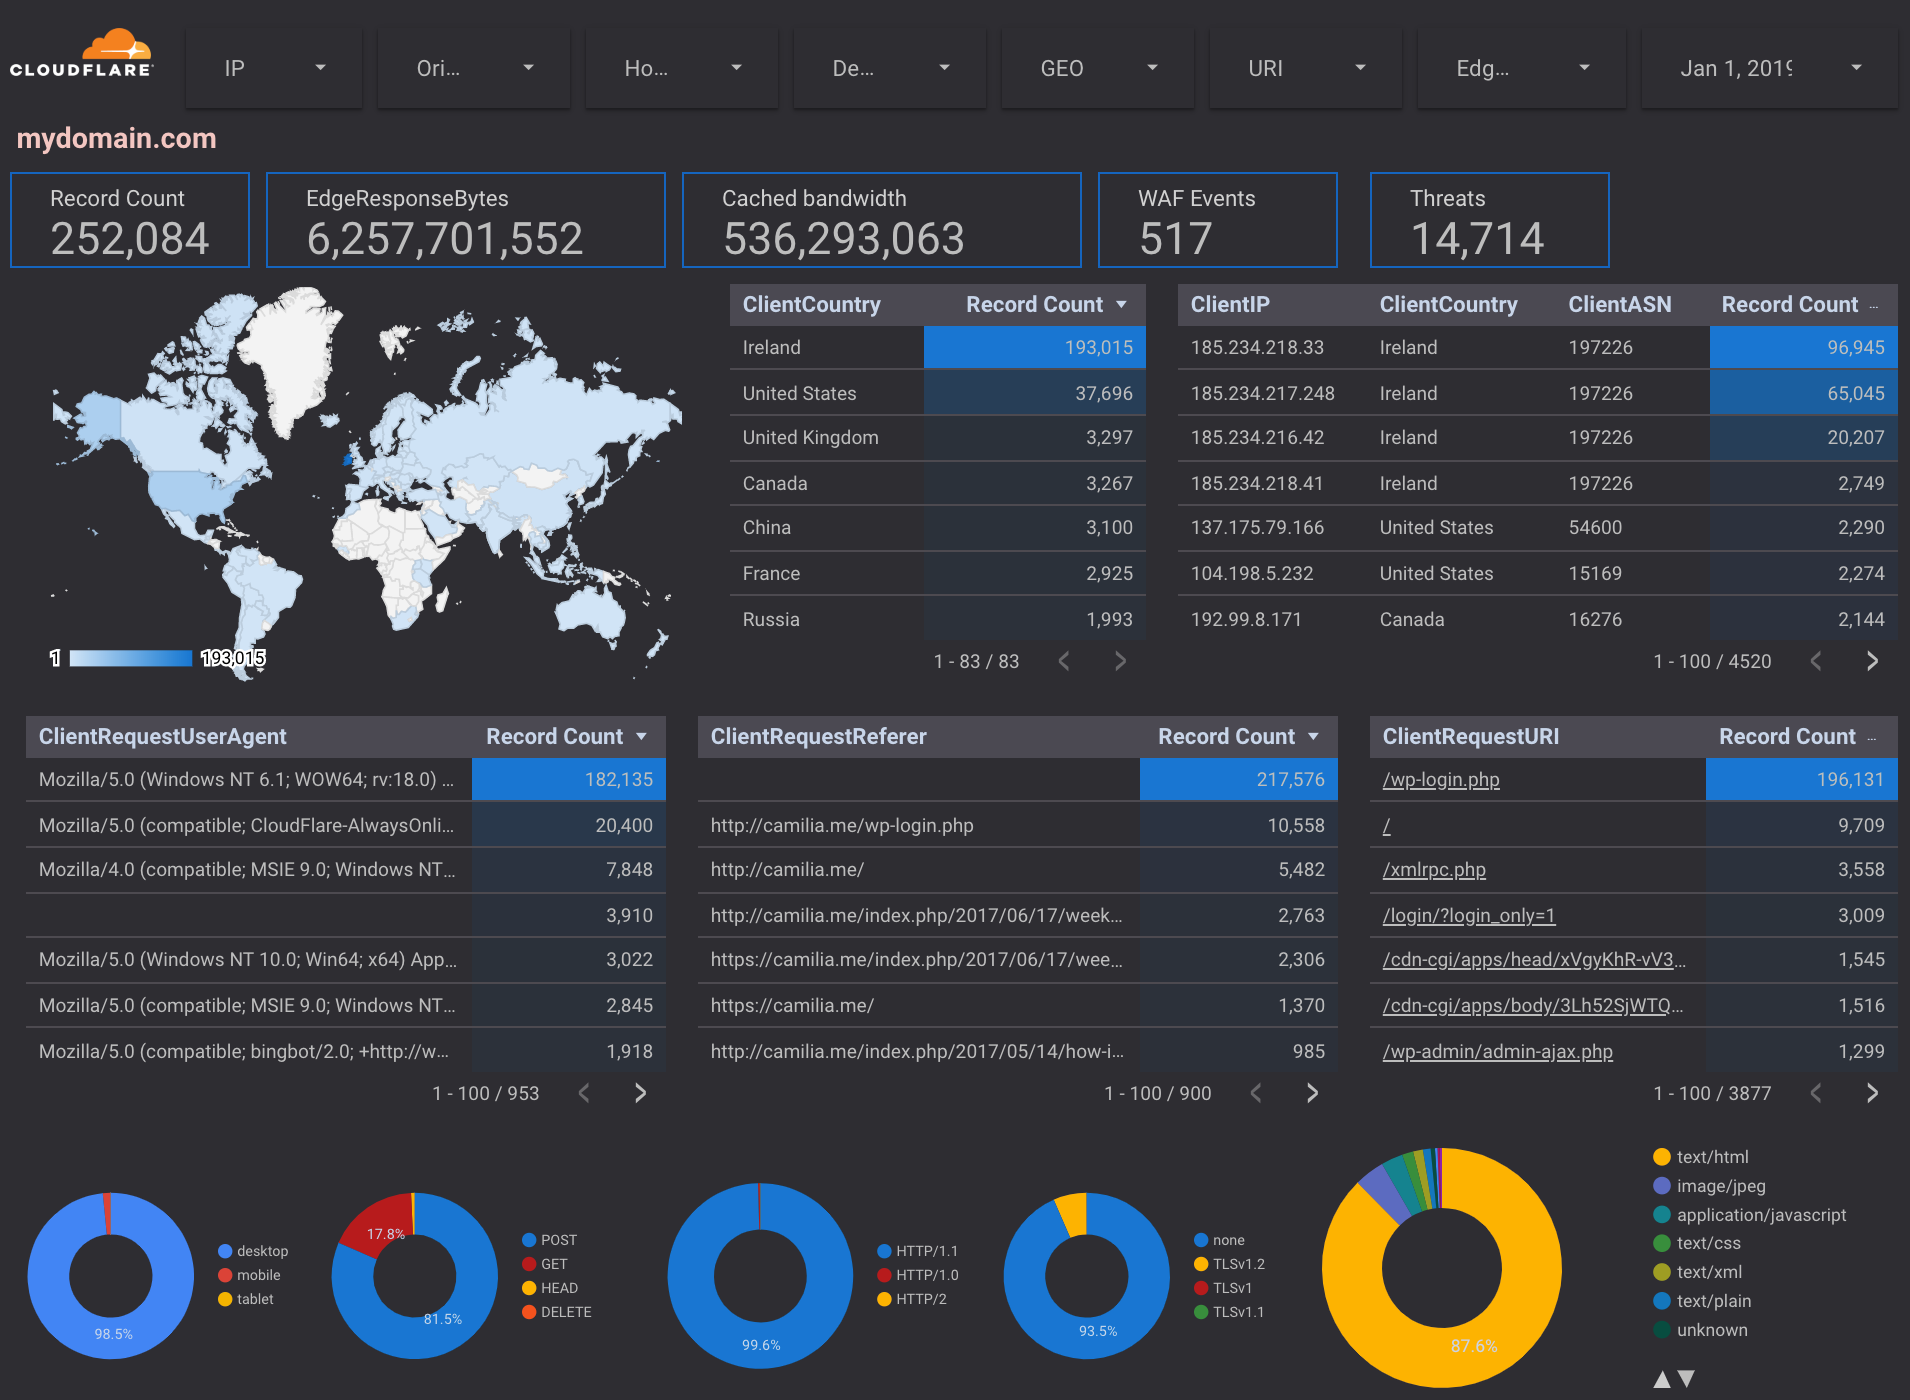
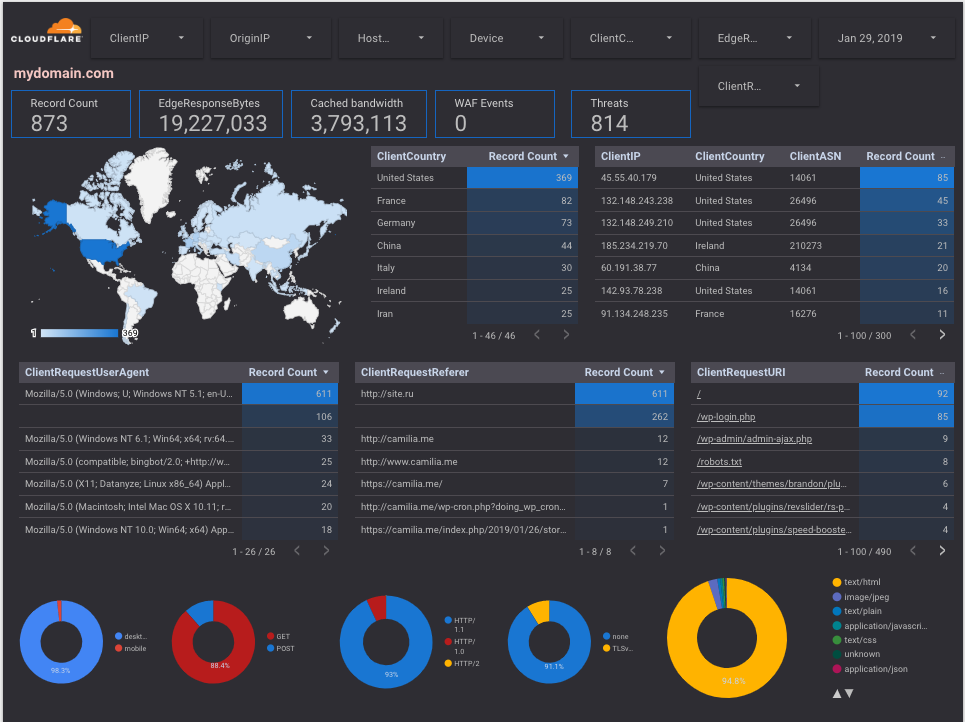
The Cloudflare Insights Template features several dashboards, or report pages, to help you analyze your Cloudflare Logs data. You can also use filters within the dashboards to narrow down the analysis by date and time, device type, country, user agent, client IP, hostname, and more. These insights further help with debugging and tracing.
The following dashboards are included in the Insights template:
Snapshot: Gives you an overview of the most important metrics from your Cloudflare logs, including total number of requests, top visitors by geography, IP, user agent, traffic type, total number of threats, and bandwidth usage.
Security: Provides insights on threat identification and mitigations by our Web Application Firewall, including Firewall Rules, Rate Limiting, and IP Firewall. Metrics include total threats stopped, threat traffic source, blocked IPs and user agents, top threat requests, Firewall events (SQL injections, XSS, etc.), and rate limiting. Use this data to fine tune the firewall to target obvious threats and avoid false positives.
Performance: Helps you identify and address issues like slow pages and caching misconfigurations. Metrics include total vs. cached bandwidth, cache ratio, top uncached requests, static vs. dynamic content, slowest URIs, and more.
Reliability: Provides insights on the availability of your websites and applications. Metrics include origin response error ratio, origin response status over time, percentage of 3xx/4xx/5xx errors over time, and more.
Create a report based on the Insights Template
To create a report for your log data based on the Cloudflare template:
In Data Studio, open the Cloudflare template and click Use Template. A Create new report dialog opens.
Under the New Data Source dropdown, select Create New Data Source. A page opens where you can enter additional configuration details.
Under Google Connectors, locate the BigQuery card and click Select.
Next under MY PROJECTS, select your Project, Dataset, and Table.
Click Connect in the upper right.
In the list of Cloudflare Logs fields, locate EdgeStartTimestamp, click the three vertical dots and select Duplicate. This creates Copy of EdgeStartTimestamp right below EdgeStartTimestamp.
Update the Type for Copy of EdgeStartTimestamp to set it to Date & Time > Date Hour (YYYYMMDDHH).
Next, update the Type for each of the following fields as indicated below:
| Cloudflare Log Field | Type |
|---|---|
| ZoneID | Text |
| EdgeColoID | Text |
| ClientSrcPort | Text |
| EdgeResponseStatus | Number |
| EdgeRateLimitID | Text |
Copy of EdgeStartTimestamp | Date & Time > Date Hour (YYYYMMDDHH) |
| OriginResponseStatus | Number |
| ClientASN | Text |
| ClientCountry | Geo > Country |
| CacheResponseStatus | Text |
Next, add a new field to identify and calculate threat. In the top right corner, click + ADD A FIELD, then in the add field UI: _ For Field Name, type Threats. _ In the Formula text box, paste the following code:
CASEWHEN EdgePathingSrc = "user" AND EdgePathingOp = "ban" AND EdgePathingStatus = "ip" THEN "ip block"WHEN EdgePathingSrc = "user" AND EdgePathingOp = "ban" AND EdgePathingStatus = "ctry" THEN "country block"WHEN EdgePathingSrc = "user" AND EdgePathingOp = "ban" AND EdgePathingStatus = "zl" THEN "routed by zone lockdown"WHEN EdgePathingSrc = "user" AND EdgePathingOp = "ban" AND EdgePathingStatus = "ua" THEN "blocked user agent"WHEN EdgePathingSrc = "user" AND EdgePathingOp = "ban" AND EdgePathingStatus = "rateLimit" THEN "rate-limiting rule"WHEN EdgePathingSrc = "bic" AND EdgePathingOp = "ban" AND EdgePathingStatus = "unknown" THEN "browser integrity check"WHEN EdgePathingSrc = "hot" AND EdgePathingOp = "ban" AND EdgePathingStatus = "unknown" THEN "blocked hotlink"WHEN EdgePathingSrc = "macro" AND EdgePathingOp = "chl" AND EdgePathingStatus = "captchaFail" THEN "CAPTCHA challenge failed"WHEN EdgePathingSrc = "macro" AND EdgePathingOp = "chl" AND EdgePathingStatus = "jschlFail" THEN "java script challenge failed"WHEN EdgePathingSrc = "filterBasedFirewall" AND EdgePathingOp = "ban" AND EdgePathingStatus = "unknown" THEN "blocked by filter based firewall"WHEN EdgePathingSrc = "filterBasedFirewall" AND EdgePathingOp = "chl" THEN "challenged by filter based firewall"Else "Other"END* Click Save in the lower right corner.
Finally, add another new field for grouping status error codes. In the top right corner, click + ADD A FIELD, then in the add field UI: _ For Field Name, type EdgeResponseStatus_Class. _ In the Formula text box, paste the following code:
CASEWHEN EdgeResponseStatus > 199 AND EdgeResponseStatus < 300 THEN "2xx"WHEN EdgeResponseStatus > 299 AND EdgeResponseStatus < 400 THEN "3xx"WHEN EdgeResponseStatus > 399 AND EdgeResponseStatus < 500 THEN "4xx"WHEN EdgeResponseStatus > 499 AND EdgeResponseStatus < 600 THEN "5xx"WHEN EdgeResponseStatus = 0 THEN "0 - Served from CF Edge"Else "Other"END
- Click Save in the lower right corner.
- To finish, click Add to Report in the upper right.
Refreshing fields and filters manually
After you’ve added your report, you will notice that not all report components render successfully. To fix this, you need to resolve any errors related to invalid dimensions, metrics, or filters that appear in the affected report components.
Update Data Studio with new fields
To update Data Studio with fields added to BigQuery, refresh fields for the data source.
In Data Studio, open the Cloudflare dashboard in Edit mode.
Expand the Resource menu and select Manage added data sources.
Click the EDIT action for the data source that you want to update.
Click REFRESH FIELDS below the table. A window with Field changes found in BigQuery will pop up.
To add the new fields, click APPLY.
You can also create custom fields directly in Data Studio.
In Data Studio, open the Cloudflare dashboard in Edit mode.
Expand the Resource menu and select Manage added data sources.
Click the EDIT action for the data source that you want to add a custom field to.
Click ADD A FIELD above the table.
Enter a formula in the Formula editor.
Click SAVE.
Fix invalid metric or dimension errors
The following table summarizes which specific components require to be fixed:
| Report page | Components | Field to add |
|---|---|---|
| 2 Security Cloudflare | Threats (scorecard) | Threats (Metric) |
Threats - Record Count (table) | Threats (Dimension) | |
| Threats Over Time (area chart) | Threats (Breadown Dimension) | |
| 3 Reliability Cloudflare | Status Codes Last 24 hours (bar chart) | Copy of EdgeStartTimeStamp (Dimension) |
| 5 Last 100s Requests Cloudflare | Last 100 Requests (table) | Copy of EdgeStartTimeStamp |
For each of the report components listed above:
Select the report component affected.
On the menu to the right, under the Data tab, locate and click Invalid Dimension or Invalid Metric (as applicable). The Field Picker panel opens.
Search or type for the field to add, then click to select it.
To finish, click away from the panel to return to the main report.
The component should now render correctly.
Update data filters
This fix applies to report page: 3 Reliability Cloudflare, for the following scorecard components in the report:
- 5xx Errors
- 4xx Errors
- 3xx Errors
To update the filter associated with each scorecard:
Select the report component affected.
On the menu to the right, under the Data tab, locate the Filters > Scorecard Filter section and click the pencil next to the filter name to edit it. The Edit Filter panel opens.
In the filtering criteria section, click the dropdown and scroll or search for the field EdgeResponseStatusClass and select it.
To finish, click Save in the lower right corner.
The component should now render correctly.