Firewall Analytics — Paid plans
Firewall Analytics is available at Security > Overview.
Adjusting displayed data
You can apply multiple filters and exclusions to narrow the scope of Firewall Analytics, as well as adjust the report duration. Modifying the duration, filters, or exclusions affects the analytics data displayed on the entire page including the Activity Log and all graphs, except for the Denial-of-service attacks mitigated graph.
Add filters
You can adjust the scope of analytics by manually entering filter conditions. Alternatively, click the Filter or Exclude buttons that appear when hovering over analytics data legend to filter by that field value.
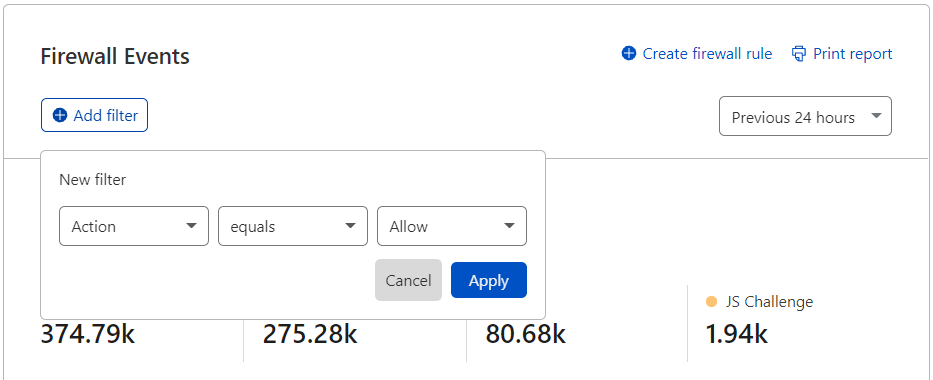
To manually add a filter:
- Click Add filter under Firewall Events.
- Select a field, an operator, and a value. For example, to filter events by IP address, select IP for Action, select equals for the operator, and enter the IP address.
- Click Apply.
Take the following into account when entering filter values:
- Do not add quotes around values.
- Do not enter the
ASprefix when entering ASN numbers. For example, enter1423instead ofAS1423. - Wildcards are not supported.
Adjust report duration
To adjust report duration, select the desired duration from the dropdown in Firewall Events.
The available report duration values depend on your Cloudflare plan. Refer to Availability for details.
Create firewall rule from current filters
To create a firewall rule based on the filters and exclusions you selected, click Create firewall rule in Firewall Events.Events summary
The Events summary section provides the number of firewall events on traffic during the selected time period, grouped according to the selected dimension (for example, Action, Host, Country, or ASN).
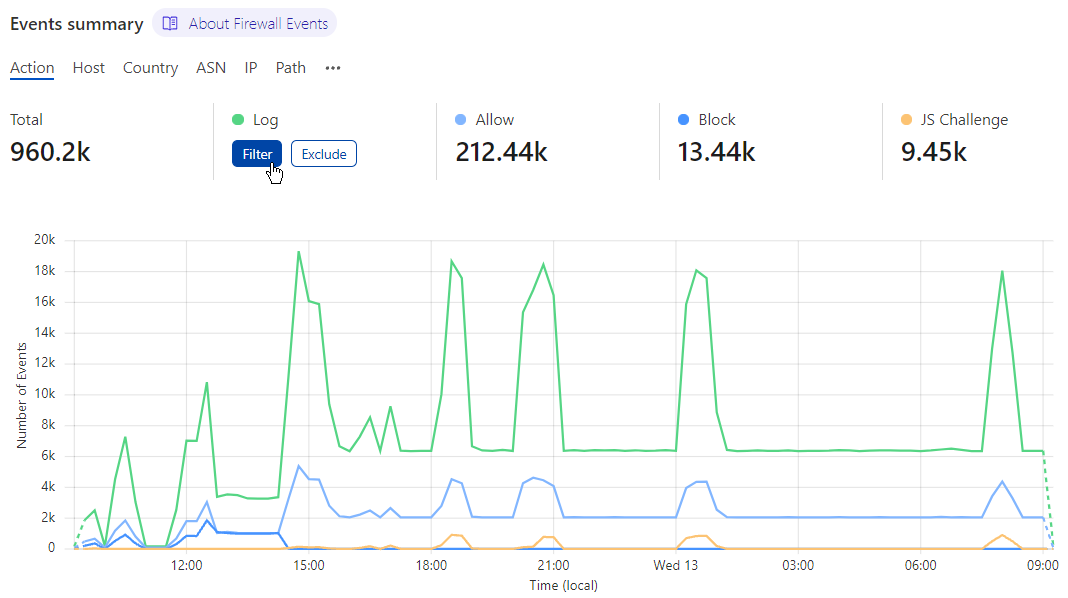
You can adjust the displayed data according to one of the values by clicking Filter or Exclude when hovering the legend.
Events by service
The Events by service section lists the firewall activity per Cloudflare security feature (for example, Managed rules, Firewall rules, API Shield).
You can adjust the scope of Firewall Analytics to one of the displayed services by clicking Filter or Exclude when hovering the legend or by clicking the corresponding graph bar.
Top events by source
In Top events by source you can find details of the traffic flagged or actioned by a Cloudflare security feature — for example, IP Addresses, User Agents, Paths, Countries, and Firewall rules.
You can adjust the scope of Firewall Analytics to one of the listed source values by clicking Filter or Exclude when hovering the value.
Activity log
The Activity log summarizes firewall events by date to show the action taken and the applied Cloudflare security feature.
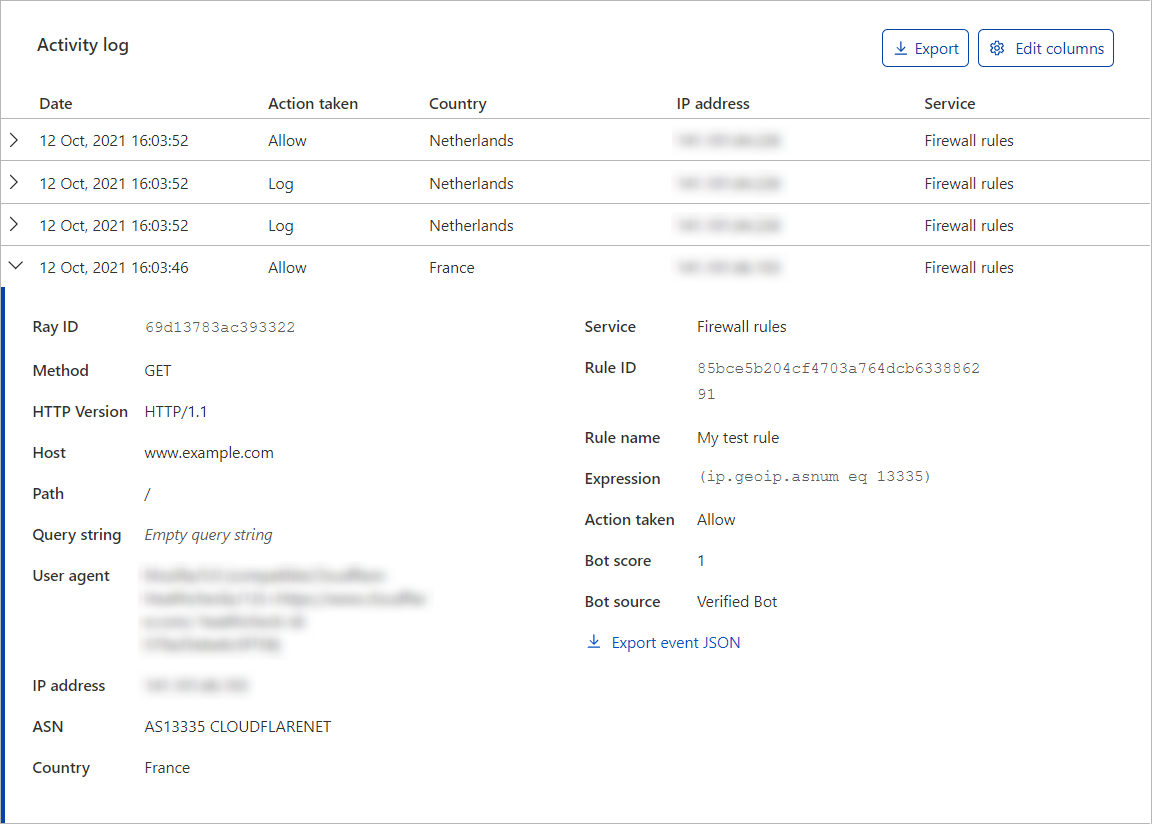
Firewall events are shown by individual event rather than by request. For example, if a single request triggers three different Firewall features, the firewall events will show three individual events in the Activity log.
Expand each event to check its details, and define filters and exclusions based on the event’s field values. Click the Filter or Exclude button when hovering a field to add the field value to the filters or exclusions list of the displayed analytics. To download the event data in JSON format, click Export event JSON.
Displayed columns
To configure the columns displayed in the Activity log, click Edit columns. This gives you flexibility depending on the type of analysis that you need to perform.
For example, if you are diagnosing a bot-related issue, you may want to display the User agent and the Country columns. On the other hand, if you are trying to identify a DDoS attack, you may want to display the IP address, ASN, and Path columns.
Event actions
For details on most actions that appear in the Activity Log, refer to Actions .
Besides the actions you can select when configuring rules in Cloudflare security products, you may also find events with the following associated actions:
- Connection Close
- Force Connection Close
For details on these actions, refer to HTTP DDoS Attack Protection parameters .
The Managed Challenge (Recommended) action that may appear in the Activity Log is available in the following security features and products: firewall rules, IP access rules, User Agent Blocking, rate limiting rules, custom rules, and Bot Fight Mode.
Export activity log data
You can export a set of up to 500 raw events from the Activity log in JSON format. Export event data to combine and analyze Cloudflare data with your own stored in a separate system or database, such as a security information and event management system (SIEM). The data you export will reflect any filters you have applied.
To export the displayed events (up to 500), click Export in the Activity log.
Share Firewall Analytics filters
When you add a filter and specify a report duration (time window) in Firewall Analytics, the Cloudflare dashboard URL changes to reflect the parameters you configured. You can share that URL with other users so that they can analyze the same information that you see.
For example, after adding a filter for Action equals Challenge and setting the report duration to 72 hours, the URL should look like the following:
https://dash.cloudflare.com/<account-id>/example.net/firewall?action=challenge&time-window=4320
Print or download PDF report
To print or download a snapshot report from your firewall events analytics dashboard, click Print report in Firewall Events. Your web browser’s printing interface will present you with options for printing or downloading the PDF report.
The generated report will reflect all applied filters.
Layer 4 denial-of-service attack mitigation
In Denial-of-service attacks mitigated you have visibility over mitigated Layer 4 denial-of-service SYN attacks towards your zones in the past seven days.
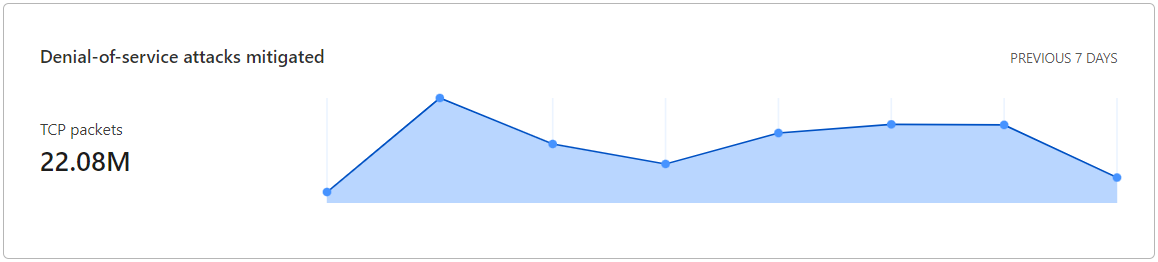
You can also use the synAvgPps1mGroups node in GraphQL to get the total attack volume for a zone over a period of time.