Debug mode
Zaraz offers a debug mode to troubleshoot the events and triggers systems. To activate debug mode you need to create a special debug cookie (zarazDebug) containing your debug key.
You can set this cookie manually or via the zaraz.debug helper function available in your console.
Log in to the Cloudflare dashboard, and select your account and website.
Go to Zaraz > Settings.
Copy your Debug Key.
Open a web browser and access its Developer Tools. For example, to access Developer Tools in Google Chrome, click View > Developer > Developer Tools.
Click the Console pane and enter the following command to create a debug cookie:
zaraz.debug("YOUR_DEBUG_KEY")Refresh your browser to see the debug logs. They will appear in the Console pane.
Zaraz’s debug mode is now enabled. To exit debug mode, just remove the cookie with zaraz.debug().
Activate Preserve Log in Google Chrome
Due to the temporary nature of the Console pane in web browsers, you might want to activate the Preserve Log option for the Console pane. If you do not activate this option, you will lose the previous debug information whenever the page refreshes.
To activate the Preserve Log option in Google Chrome:
- Open Developer Tools.
- Go to Console.
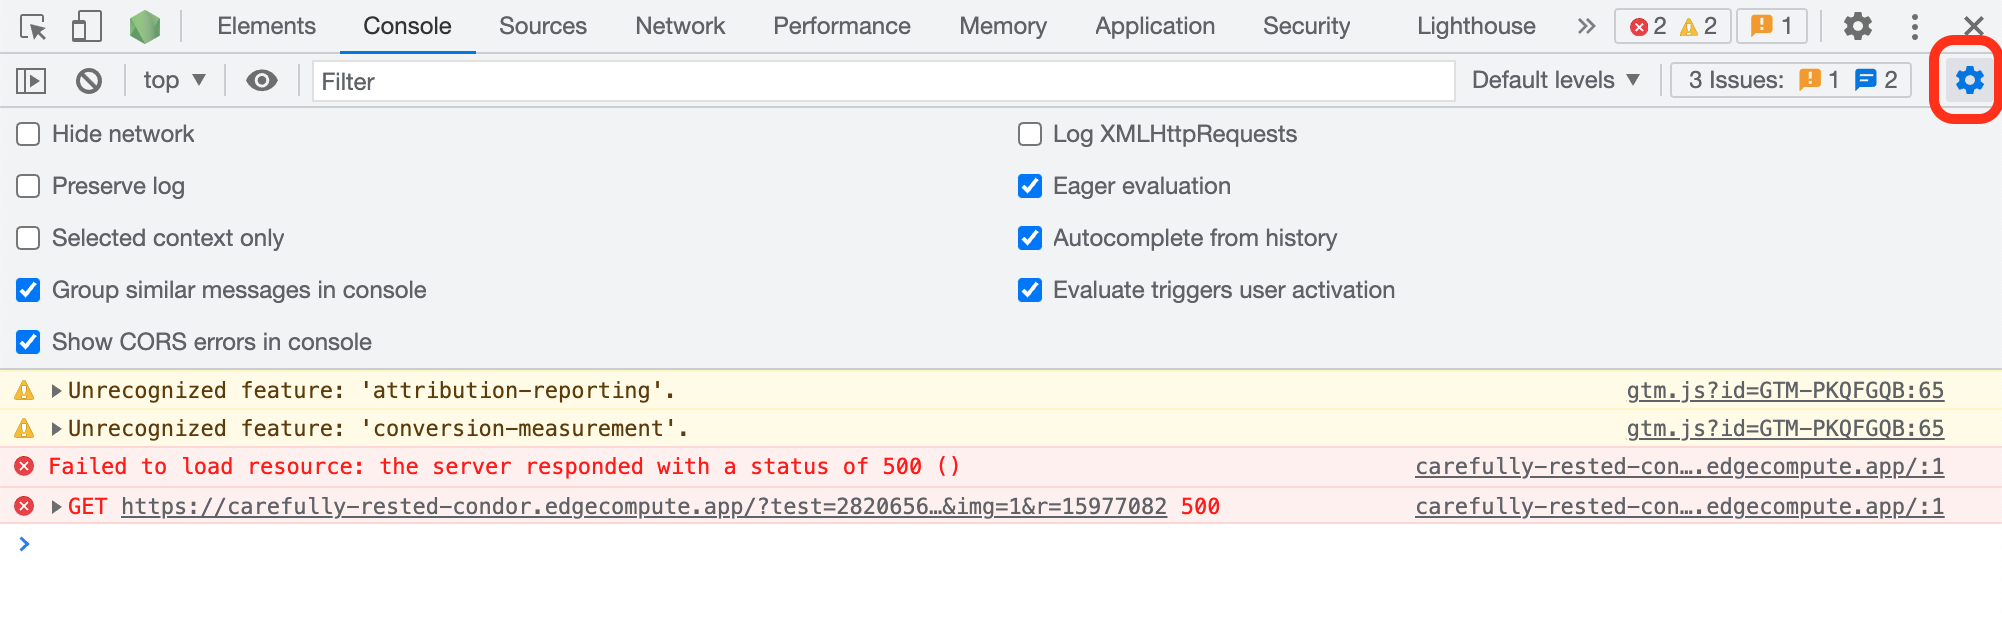
- Select the Console settings cog > Preserve logs.